

Image Details
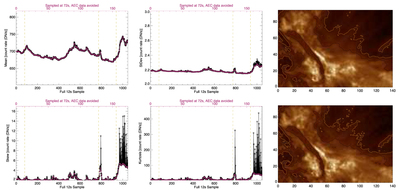
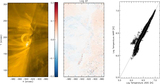
Caption: Figure 4.
Example parameter curves from AARP #750 (NOAA AR #11261) for 193 Å on 2011 August 3 00:00–03:30 UT; the start of a subflare at 00:18 UT, a C1.2 at 02:35 UT and the M1.1 flare at 03:08 UT are indicated by dashed vertical lines. The bottom x-axis is an image index for the original 12 s sampling (black); the top x-axes are the indices for the 72 s sampling (red) used for the AARPs that naturally avoided the AEC-triggered images. All data were exposure-normalized. Left four panels show the four moments of the images, as indicated. Right two panels show a small subarea of the full AARP field of view that includes a small filament and nearby loop-bottoms (top/right of the images), but avoids the M1.1 flare-emission area, for two consecutive 12 s sampled images, Top: normal 2 s exposure, Bottom: 0.43 s exposure, when AEC-mode was invoked. Light/dark contours indicate the [2, 3] σ signal-to-noise levels, with the noise level determined by the most-probable value of low-signal parts of the image.
Other Images in This Article
Copyright and Terms & Conditions
© 2023. The Author(s). Published by the American Astronomical Society.

