

Image Details
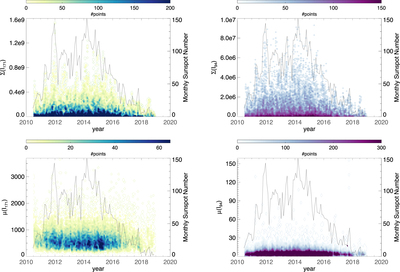
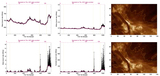
Caption: Figure 5.
Top row: density histograms of the total emission of each AARP for 171 Å (left) and 94 Å (right) as a function of date; left axes. Also plotted is the monthly mean sunspot number from SILSO World Data Center (2010–2018); right axes. The density histograms do include the “single-point” values as the lowest contour/ lightest color. Bottom row: same presentation but for the mean emission (size-normalized) of the two bandpasses.
Other Images in This Article
Copyright and Terms & Conditions
© 2023. The Author(s). Published by the American Astronomical Society.

Copyright ©
2026 Astronomy Image Explorer. All Rights Reserved.
