Image Details
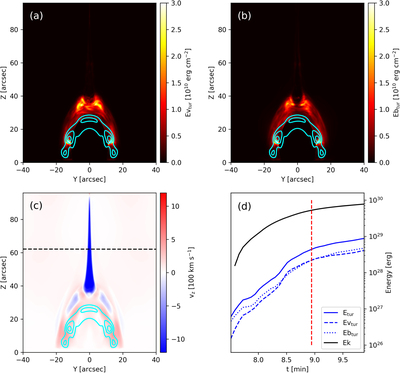
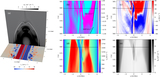
Caption: Figure 5.
(a) Spatial distribution of turbulent kinetic energy. (b) Spatial distribution of turbulent magnetic energy. (c) X-averaged vertical speed distribution. In panel (d), we show the time-integrated reconnection-downflow kinetic energy (black solid line) that goes through the surface, taken along the black dashed line in panel (c). Panel (d) further shows in a blue solid line the instantaneous total turbulence energy and its division over kinetic energy and turbulent magnetic energy. In panel (d), the vertical red solid line corresponds to the time for panels (a), (b), and (c). As in Figure 2, the contours in panels (a), (b), and (c) show the AIA/131 loop location.
Other Images in This Article
Copyright and Terms & Conditions
© 2023. The Author(s). Published by the American Astronomical Society.