Image Details
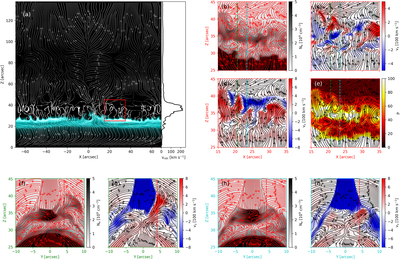
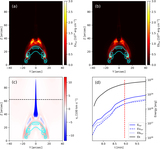
Caption: Figure 3.
Color map in (a): AIA/131 emission flux distribution at slice Y ∼ 4″ along the white dashed vertical line in Figure 2(b). At the RHS of panel (a) we show nonthermal velocity. Panels (b)–(e): N e, v x , v z , and thermal pressure inside the red box in panel (a). Panels (f) and (g): N e and v z at a slice marked with a green dashed line in (b)–(e). Panels (h) and (i): N e and v z at a slice marked with the cyan dashed line in (b)–(e). The red vertical dashed lines in panels (f)–(i) give the location of the slice shown in panels (b)–(e). Streamlines in (a)–(e) show the velocity field given by ﹩{v}_{x}{\vec{e}}_{x}+{v}_{z}{\vec{e}}_{z}﹩, while those in (f)–(i) show the field given by ﹩{v}_{y}{\vec{e}}_{y}+{v}_{z}{\vec{e}}_{z}﹩. The width of streamlines in panel (a) is in proportion to ﹩\sqrt{{v}_{x}^{2}+{v}_{z}^{2}}﹩ to highlight the turbulent regions, while that in other panels is constant.
Other Images in This Article
Copyright and Terms & Conditions
© 2023. The Author(s). Published by the American Astronomical Society.