Image Details
Caption: Figure 1.
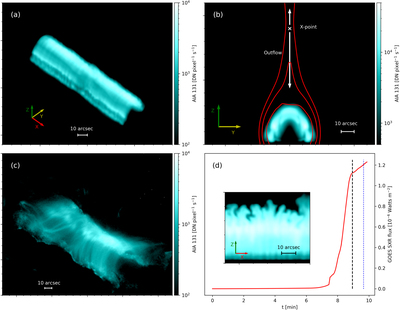
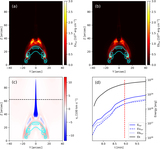
Panels (a) and (b) show synthesized 131 Å views of the flare loop systems obtained in our simulation. The two views are synthesized with different line of sight (LOS) directions, where the corresponding orientation axes are given. The red curves in (b) are projections of several magnetic field lines. The approximate locations of the magnetic reconnection X-point (white cross) and the reconnection outflows (white arrows) are also given in (b). Panel (c) shows a 131 Å image of a flare event from 2011 December 26, where the LOS direction is similar to that in (a), as reported by Cheng & Qiu (2016). Panel (d) gives the time development of synthesized GOES SXR flux at 1–8 Å passband, where the black dashed line gives the corresponding time of the synthesized views. A cross section in the X Z-plane, in a zoomed-in view on the top of the arcade, shown in panel (d), confirms the RTI/RMI process from Shen et al. (2022) happening at a later time, referring to the blue dotted line in this panel. An animation of this figure is available. Panels (a)–(c) of the animation give synthesized 131 Å views obtained with different LOSs, where the corresponding orientation axes are given. Panel (d) of the animation shows the synthesized GOES SXR flux at the 1–8 Å, the same as panel (d) of this figure. The animation covers ∼10 minutes of physical time starting at t = 0 (real-time duration 14 s).
(An animation of this figure is available.)
The video/animation of this figure is available in the online journal.
Other Images in This Article
Copyright and Terms & Conditions
© 2023. The Author(s). Published by the American Astronomical Society.