Image Details
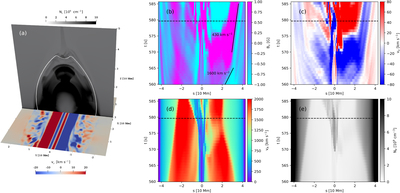
Caption: Figure 4.
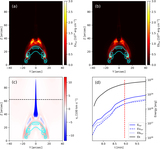
Panel (a): horizontal slice in 3D view shows v x distribution at z = 2 Mm, while the vertical slice shows the N e distribution at x = 30 Mm. Panels (b)–(e): Time–space plots of B x , v x , Alfvén speed v A, and N e along the white solid (field) line shown in (a), where the minimum s-value is located at the left end of this line. The horizontal dashed lines in panels (b)–(e) and the vertical dotted line in Figure 1(d) give the corresponding time for the 3D view in (a).
Other Images in This Article
Copyright and Terms & Conditions
© 2023. The Author(s). Published by the American Astronomical Society.