Image Details
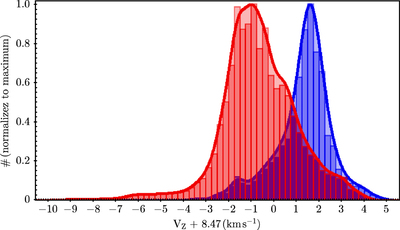
Caption: Figure 9.
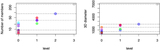
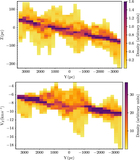
Histogram of V Z + 8.47 km s−1. The constant is the median of V Z in the area under study. We have shifted V Z for a better visualization of the vertical velocity behavior in both hemispheres. The red shows V Z for Z ≤ 0 and the blue that for Z > 0.
Other Images in This Article
Show More
Copyright and Terms & Conditions
© 2022. The Author(s). Published by the American Astronomical Society.
Copyright ©
2025 Astronomy Image Explorer. All Rights Reserved.