Image Details
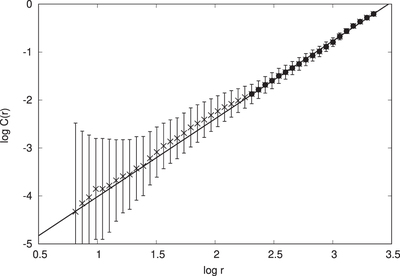
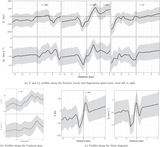
Caption: Figure 2.
The calculated correlation integral C(r) for the data used in this work. The error bars represent the standard deviations σ C . The solid line is the best linear fit in the range of reliable values indicated by the solid circles, i.e., the range for which σ C ≲ C (r).
Other Images in This Article
Show More
Copyright and Terms & Conditions
© 2022. The Author(s). Published by the American Astronomical Society.
Copyright ©
2025 Astronomy Image Explorer. All Rights Reserved.