Image Details
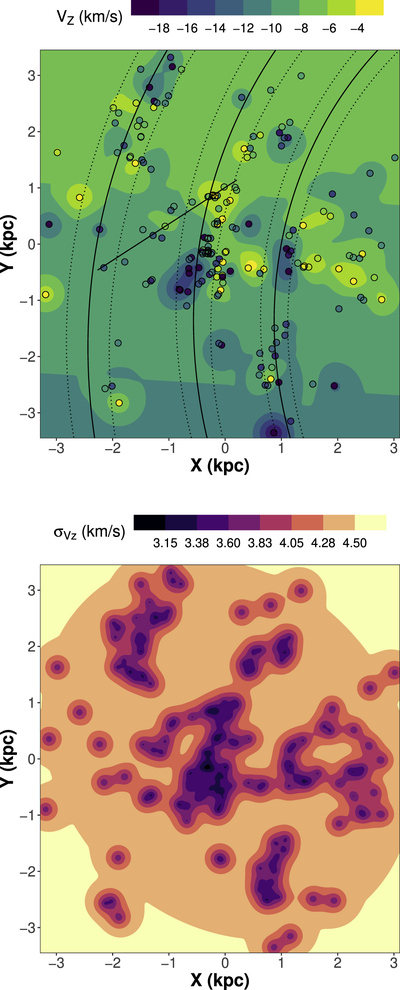
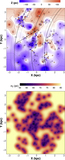
Caption: Figure 7.
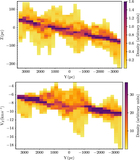
Analogous to Figure 6. Top: V Z (X, Y) map. In this case, we have used a discrete scale, as it better suits the minor deviation or range of this variable. Bottom: the Kriging prediction standard deviation ﹩{\sigma }_{{V}_{Z}}﹩ map (Equation (A3)).
Other Images in This Article
Show More
Copyright and Terms & Conditions
© 2022. The Author(s). Published by the American Astronomical Society.
Copyright ©
2025 Astronomy Image Explorer. All Rights Reserved.