Image Details
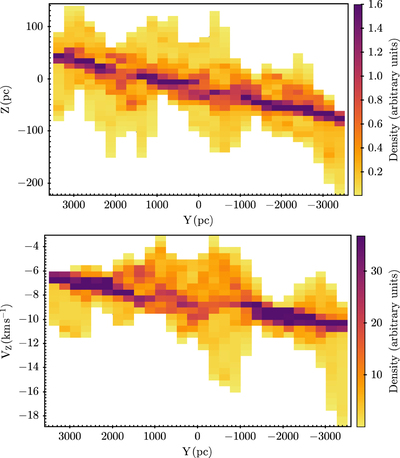
Caption: Figure 10.
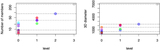
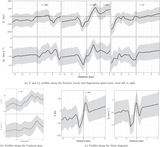
In the top panel, a Z(X, Y) map projected onto the Y-axis, both in pc units. Negative Y values correspond to the III and IV Galactic quadrants. A gradient Z(Y) is clearly visible, overimposed with a wave-like structure. In the bottom panel, a V Z (X, Y) map in km s−1 projected onto the Y-axis in pc. Negative Y values correspond to the III and IV Galactic quadrants. A gradient V Z (Y) is the main feature of the plot.
Other Images in This Article
Show More
Copyright and Terms & Conditions
© 2022. The Author(s). Published by the American Astronomical Society.
Copyright ©
2025 Astronomy Image Explorer. All Rights Reserved.