Image Details
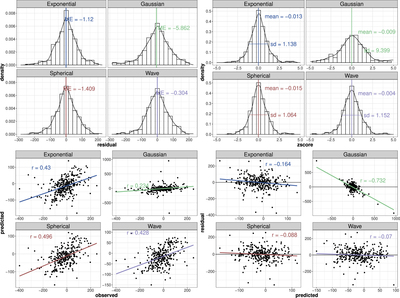
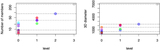
Caption: Figure 16.
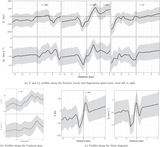
Cross-validation analysis for the Z variogram model selection. The bottom left panels show the correlation between the observed and predicted data, which is ideally close to 1. The bottom right panels show the correlation between the predictions and the residuals, which is ideally close to zero. In both cases, except for the Gaussian model, the results are quite similar.
Other Images in This Article
Show More
Copyright and Terms & Conditions
© 2022. The Author(s). Published by the American Astronomical Society.
Copyright ©
2025 Astronomy Image Explorer. All Rights Reserved.