Image Details

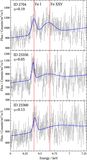
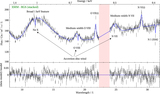
Caption: Figure 14.
XMM-Newton RGS 1, RGS 2, and EPIC pn spectra from the high state part of observation 0865440101. Only narrow energy bands around the strongest disk wind absorption lines N VII, O VIII, Ne X, and Fe XXV I are shown. The first three subplots contain RGS 1 and RGS 2 data only, the fourth subplot only contains EPIC pn data. The fourth subplot shows the effect of applying or removing the EPIC pn gain-shift correction, described in Appendix A. The Fe XXVI residual can be correctly aligned with the residuals in RGS spectra by applying a blueshift to the EPIC spectral model of about −0.016 c (a linear shift of 110 eV at 7 keV).
Other Images in This Article

Show More
Copyright and Terms & Conditions
© 2022. The Author(s). Published by the American Astronomical Society.