Image Details
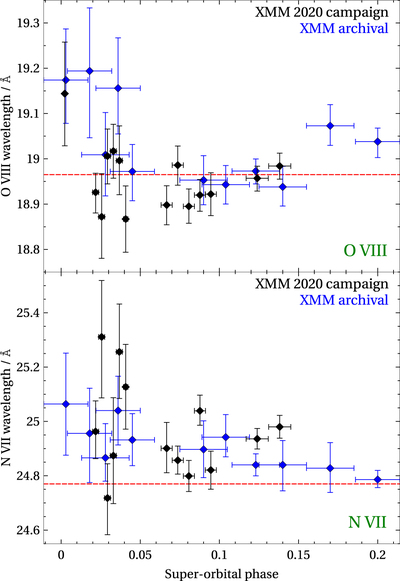
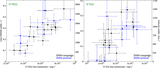
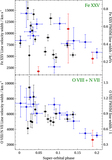
Caption: Figure 9.
The best-fitting wavelength of the O VIII line (top subplot) and the N VII line (bottom subplot) vs. the super-orbital phase. The observations with XMM-Newton during the 2020 campaign, and previously, are shown in distinct colors. The red dashed horizontal lines indicate the rest-frame wavelengths of the two transitions.
Other Images in This Article
Show More
Copyright and Terms & Conditions
© 2022. The Author(s). Published by the American Astronomical Society.
Copyright ©
2025 Astronomy Image Explorer. All Rights Reserved.