Image Details
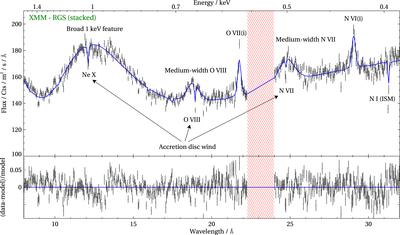
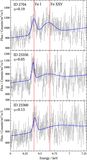
Caption: Figure 5.
RGS spectrum (RGS 1 and 2 stacked for visual purposes) from the full 100 ks long observation 0865440401 (top panel), fitted with the full spectral model. Notable spectral components and features are described with labels. The red shaded region was ignored in this analysis (Appendix B). The bottom subpanel shows the ratio residuals to the best-fitting model.
Other Images in This Article

Show More
Copyright and Terms & Conditions
© 2022. The Author(s). Published by the American Astronomical Society.
Copyright ©
2025 Astronomy Image Explorer. All Rights Reserved.