Image Details
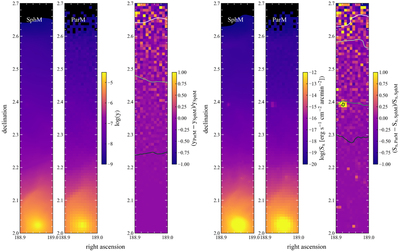
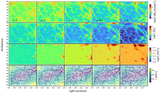
Caption: Figure 14.
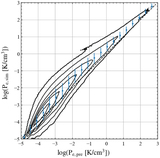
The left three panels show SZ y-maps of a small region in the GW simulation. The left one is obtained by using the SphM method, the middle one by using ParM, and the right one shows the difference between the two methods. The three contours in the difference map show ﹩\mathrm{log}{y}_{\mathrm{SphM}}=-7﹩, −8, and −9, respectively. The right three panels show the results for the X-ray brightness, S x,SphM, S x,ParM , and their difference, respectively. The contours in the right panel show ﹩\mathrm{log}{S}_{x,\mathrm{SphM}}=-17﹩, −18, −19, and −20, respectively.
Other Images in This Article
Show More
Copyright and Terms & Conditions
© 2022. The Author(s). Published by the American Astronomical Society.