Image Details
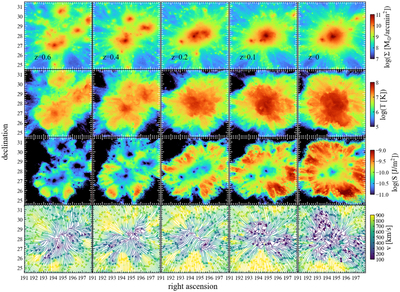
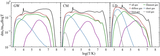
Caption: Figure 2.
The evolution of the Coma galaxy cluster in the CM simulation from z = 0.6 to z = 0. The top shows the surface mass density of gas particles, the second row shows the gas temperature, the third row shows the gas entropy, and the bottom row shows the velocity component that is perpendicular to the line of sight. Note that the mean velocity is removed.
Other Images in This Article
Show More
Copyright and Terms & Conditions
© 2022. The Author(s). Published by the American Astronomical Society.
Copyright ©
2025 Astronomy Image Explorer. All Rights Reserved.