Image Details
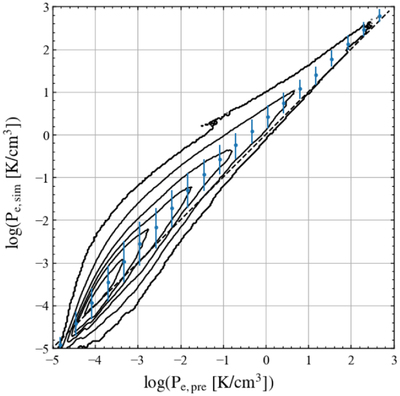
Caption: Figure 8.
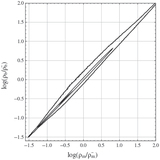
The predicted electron pressure (﹩{P}_{{\rm{e}},\mathrm{pre}}﹩) vs. the simulated electron pressure (﹩{P}_{{\rm{e}},\mathrm{sim}}﹩). The contours enclose, respectively, 10%, 30%, 50%, 70%, 90%, 99% of all the cells, each being a cube of ﹩{(0.1\,{h}^{-1}\mathrm{Mpc})}^{3}﹩. The points show the median ﹩{P}_{{\rm{e}},\mathrm{sim}}﹩ as a function of ﹩{P}_{{\rm{e}},\mathrm{pre}}﹩, and error bars show the 16 and 84 percentiles. The dashed line corresponds to the one-to-one relation between the predicted and simulated electron pressures. Note that a typical filament with ﹩{\rho }_{{\rm{b}}}=10{\bar{\rho }}_{{\rm{b}}}﹩ and ﹩\mathrm{log}(T/{\rm{K}})=5.5﹩ has a pressure of 0.71K cm−3.
Other Images in This Article
Show More
Copyright and Terms & Conditions
© 2022. The Author(s). Published by the American Astronomical Society.