Image Details
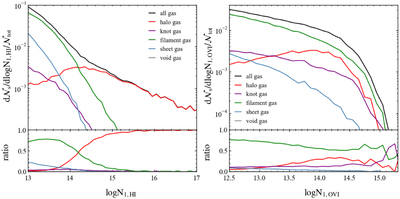
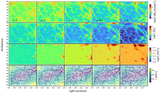
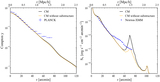
Caption: Figure 13.
The upper panels show the distributions of H I (left) and O VI (right) column density obtained from the GW simulation. The column density is calculated by integrating the corresponding ion density over an interval of 1 h −1Mpc. Black lines show the results for all gas particles regardless of the types of the cosmic structure where they are located. The color-coded lines show the contributions of different components of the cosmic web. The contribution of the void gas is below the bottom of the plot. The lower panels show the ratio of the distributions of different components of cosmic web to all gas. See the text for details of the analysis.
Other Images in This Article
Show More
Copyright and Terms & Conditions
© 2022. The Author(s). Published by the American Astronomical Society.