Image Details
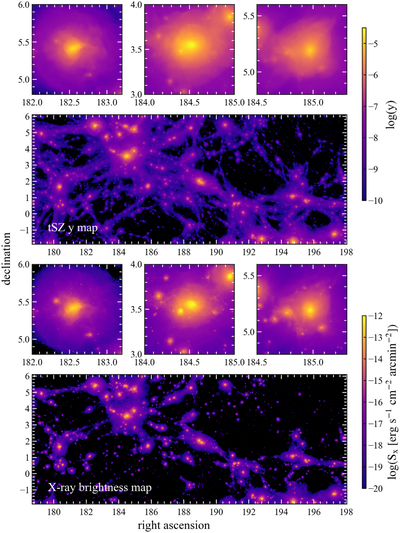
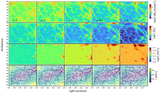
Caption: Figure 11.
Maps of the y-parameter (the upper two rows) and X-ray (0.3–2 KeV band) brightness (the lower two rows) in the GW simulation. The first and third rows show the results for the three massive galaxy clusters in the supercluster complex located at α J ∼ 184 and δ J ∼ 4.5.
Other Images in This Article
Show More
Copyright and Terms & Conditions
© 2022. The Author(s). Published by the American Astronomical Society.
Copyright ©
2025 Astronomy Image Explorer. All Rights Reserved.