Image Details
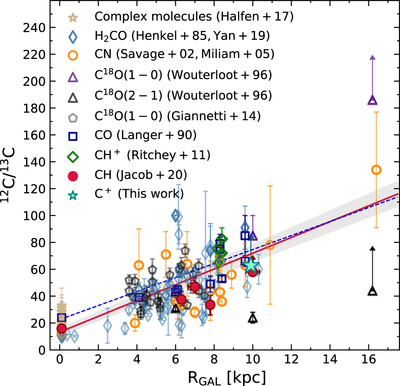
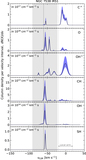
Caption: Figure 17.
12C/13C isotopic abundance ratio as a function of Galactocentric distance, R GAL (kpc) adapted from Jacob et al. (2020a). The teal star represents the 12C/13C ratio obtained using C+ (this paper). The black solid line represents the weighted fit to the data except that from this work with the gray shaded region demarcating the 1σ interval of this fit.
Other Images in This Article
Show More
Copyright and Terms & Conditions
© 2022. The Author(s). Published by the American Astronomical Society.
Copyright ©
2025 Astronomy Image Explorer. All Rights Reserved.