Image Details
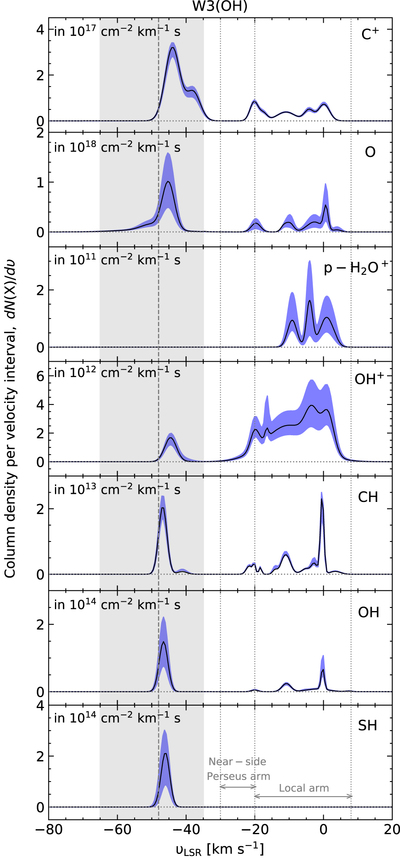
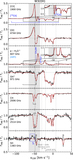
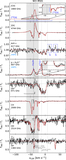
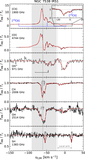
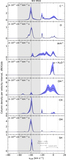
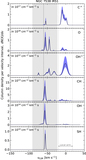
Caption: Figure 7.
Top to bottom: channel-wise column density profile (dN/dυ) of C+, O, p-H2O+, OH+, CH, OH, and SH for the foreground absorbing clouds along the line of sight toward W3(OH). The blue shaded region represents the uncertainties (2σ confidence interval), while the gray dashed line and shaded region mark the systemic velocity of the source and highlight the velocity dispersion of the source, respectively.
Other Images in This Article
Show More
Copyright and Terms & Conditions
© 2022. The Author(s). Published by the American Astronomical Society.
Copyright ©
2025 Astronomy Image Explorer. All Rights Reserved.