Image Details
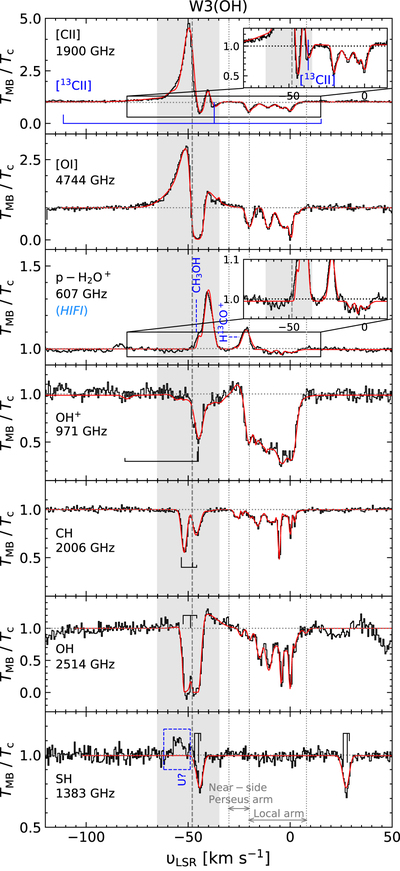
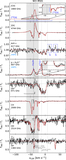
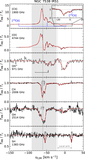
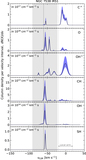
Caption: Figure 4.
From top to bottom: spectra in T MB scales normalized with respect to the continuum temperature, T c, showing transitions of C+, O, p-H2O+ (observed with Herschel/HIFI and taken from Indriolo et al. 2015), OH+, CH, OH, and SH, respectively, toward W3OH, in black, with the XCLASS fits in red. The inset in the top panel zooms-in on the C+ absorption features over a range of υ LSR between −80 and 15 km s−1. The vertical gray dashed line and gray shaded regions mark the systemic velocity and the typical velocity dispersion of the source. The relative intensities of the hyperfine-structure components of the OH+, CH, and OH transitions are shown in black and 13C+ in blue above/below their respective spectra. Contaminating emission features that are identified are labeled in blue and their contributions modeled and removed in all subsequent analysis, while those that remain unidentified are marked (U?).
Other Images in This Article
Show More
Copyright and Terms & Conditions
© 2022. The Author(s). Published by the American Astronomical Society.