Image Details
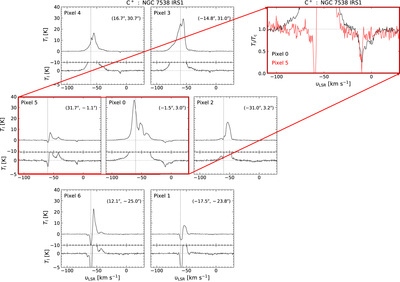
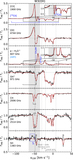
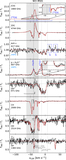
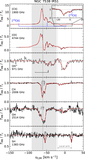
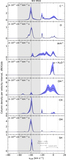
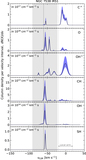
Caption: Figure 15.
Left: LFA/upGREAT footprint displaying the [C II] spectral line profiles as observed in each of its seven pixels centered on the background continuum source NGC 7538 IRS1 in the top panels, while the bottom panels zoom-in on the respective spectra to better see the absorption components. Right: overlay comparing the line-of-sight absorption observed in the continuum normalized [C II] spectra obtained from pixel 0 (in black) and pixel 5 (in red).
Other Images in This Article
Show More
Copyright and Terms & Conditions
© 2022. The Author(s). Published by the American Astronomical Society.
Copyright ©
2025 Astronomy Image Explorer. All Rights Reserved.