Image Details
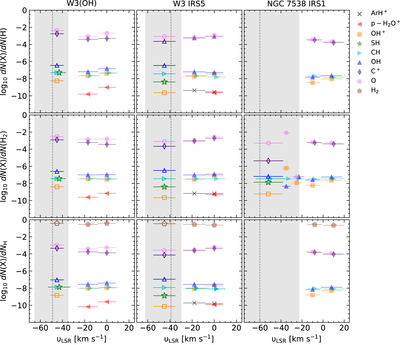
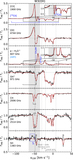
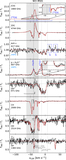
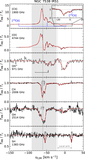
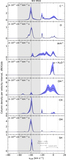
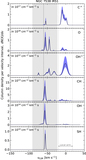
Caption: Figure 14.
From top to bottom: inferred N(X)/N(H), N(X)/N(H2), and N(X)/N H ratios over the adopted velocity intervals for W3(OH), W3 IRS5, and NGC 7538 IRS1 from left to right, with the different species denoted using different markers and colors as displayed in the legend. The filled and unfilled markers demarcate the column densities determined toward line-of-sight and molecular cloud features, respectively. The gray dashed lines and shaded regions indicate the systemic velocity and velocity dispersion of the source, respectively, where the column densities determined only form lower limits. Markers lying close to each other are shifted by +2 km s−1 for clarity. Covering a large range of abundances, we do not display the corresponding errors in this plot as they coincide with the length scales of the markers.
Other Images in This Article
Show More
Copyright and Terms & Conditions
© 2022. The Author(s). Published by the American Astronomical Society.