Image Details
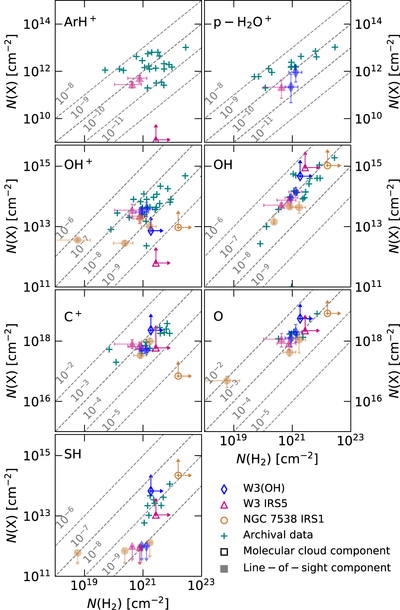
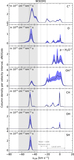
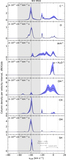
Caption: Figure 11.
Comparison of column densities of the key HyGAL species with N(H2) determined using N(CH)/N(H2) = 3.5 × 10⁻⁸ (Sheffer et al. 2008) and integrated over the velocity intervals discussed in Table 5. The data points toward W3(OH), W3 IRS5, and NGC 7538 IRS1 are plotted using blue diamonds, pink triangles, and dark orange circles, respectively where the filled and unfilled markers demarcate the column densities determined toward line-of-sight components (features that are not associated with the background molecular cloud) and molecular cloud components as discussed in Table 5. The dashed gray lines represent lines of constant abundances N(X)/N(H2) for each studied species X as labeled on the top left-hand corner of each panel. The data represented using teal crosses present results from previous observations as discussed in the text.
Other Images in This Article
Show More
Copyright and Terms & Conditions
© 2022. The Author(s). Published by the American Astronomical Society.