Image Details
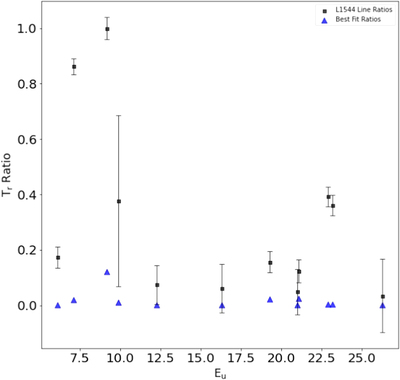
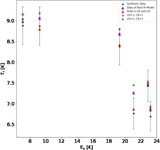
Caption: Figure 8.
TR against the energy of the upper state for all emission lines in Table 4, compared to the data of the best-fit model after running the stress-test inference. While some lines almost fit their observed counterparts, it is clear that UCLCHEMCMC is unable to match all lines at once, which caused it to settle for a set of parameters that allow each line to at least get somewhat close to the observations. Black represents the real data with error bars, and blue shows the best-fit model.
Other Images in This Article
Copyright and Terms & Conditions
© 2022. The Author(s). Published by the American Astronomical Society.
Copyright ©
2025 Astronomy Image Explorer. All Rights Reserved.