Image Details

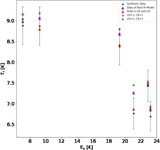
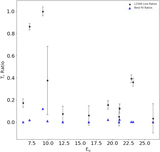
Caption: Figure 6.
TR over TR of OCS 6-5 against the upper state energy for emission lines of OCS found in Table 4, compared to the data of the best-fit model after running an inference using only the OCS lines. All of the lines fit the observed line ratios quite well. Black represents the real data with error bars, and blue shows the best-fit model.
Other Images in This Article
Copyright and Terms & Conditions
© 2022. The Author(s). Published by the American Astronomical Society.
Copyright ©
2025 Astronomy Image Explorer. All Rights Reserved.