Image Details
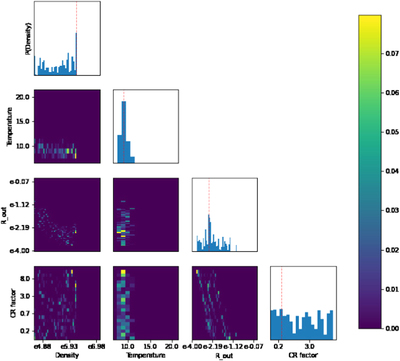
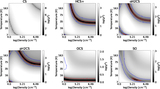
Caption: Figure 5.
Posterior distribution function of the evaluation run performed on the emission lines from OCS only. The histograms represent the PDF of the volume density, kinetic temperature, Rout, and the CR ionization rate factor, the color bar shows the value ranges of the joint distribution functions, and the dashed red line in the PDF is the value with the highest probability.
Other Images in This Article
Copyright and Terms & Conditions
© 2022. The Author(s). Published by the American Astronomical Society.
Copyright ©
2025 Astronomy Image Explorer. All Rights Reserved.