Image Details
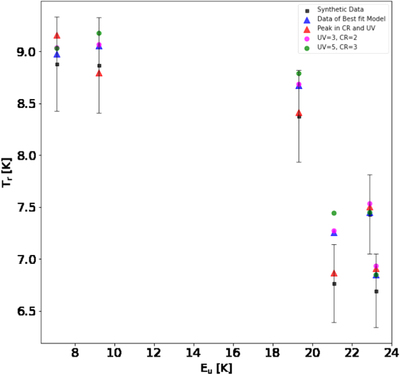
Caption: Figure 4.
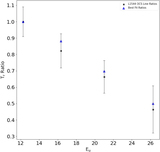
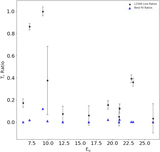
The radiation temperature, TR, calculated by RADEX against the energy of the upper state for the mock data and errors given to UCLCHEMCMC are shown in black, and the data created when using the most likely parameter values from the 1D distributions from the inference of the mock data are plotted in blue. Red represents the peak in the joint distribution of the CR ionization rate and UV radiation field while keeping the remaining parameters as they are for the previous model, while green and fuchsia represent two additional points with values for the CR ionization rate and UV radiation field values in the elongated distribution of likely values to show why the inference still gave some importance to these values.
Other Images in This Article
Copyright and Terms & Conditions
© 2022. The Author(s). Published by the American Astronomical Society.