Image Details
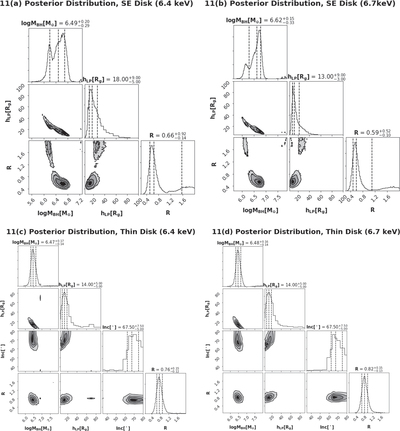
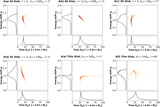
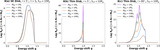
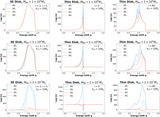
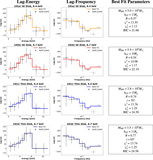
Caption: Figure 11.
The 1D histograms located on the top of each column show the posterior distribution for each parameter from the MCMC algorithm. Note that the values shown are the most probable values of the parameters, which are different from best-fit parameters giving the lowest χ2 presented in Figure 10. The vertical dashed lines mark the 16th, 50th, and 84th percentiles of probability. Also, for each parameter pair, we show the joint 2D histogram of the posterior distribution. The contours correspond to the 16th, 50th, and 84th percentiles.
Other Images in This Article
Copyright and Terms & Conditions
© 2022. The Author(s). Published by the American Astronomical Society.
Copyright ©
2025 Astronomy Image Explorer. All Rights Reserved.