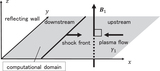
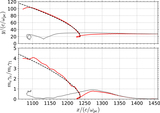
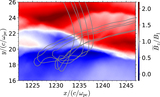
Image Details

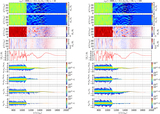
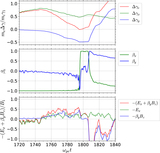
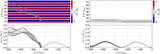
Caption: Figure 3.
Energy spectra of electrons (blue) and ions (red) for γ1 = 40 (top panels) and γ1 = 100 (bottom panels). The downstream spectra (left panels), the upstream spectra (middle panels), and the upstream spectra measured in the proper frame (right panels) are shown.
Other Images in This Article
Show More
Copyright and Terms & Conditions
© 2022. The Author(s). Published by the American Astronomical Society.
Copyright ©
2025 Astronomy Image Explorer. All Rights Reserved.