Image Details
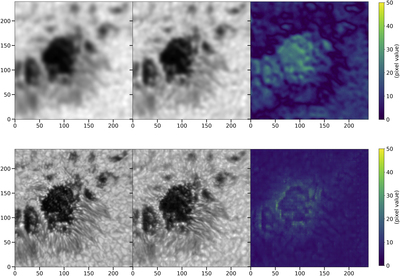
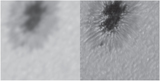
Caption: Figure 8.
The first row, from left to right, shows the HMI image, the reconstructed image blurred to the HMI resolution, and the residual image, respectively. The second row, from left to right, shows the GST image, reconstructed image, and predicted residual image, respectively. The residual image shows the difference between the pixel values of the two images.
Other Images in This Article
Copyright and Terms & Conditions
© 2021. The American Astronomical Society. All rights reserved.
Copyright ©
2025 Astronomy Image Explorer. All Rights Reserved.