Image Details
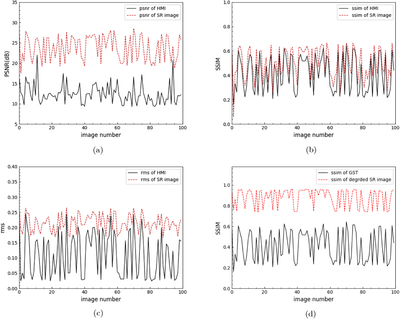
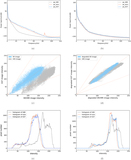
Caption: Figure 6.
PSNR, SSIM, and rms index of test results. The black line in (a), (b), and (c) represents the index of the HMI image and GST image, and the red line represents the index of the SR image and GST image. (d) shows the SSIM index of the HMI image and GST image, as well as the index of the HMI image and the degraded SR image.
Other Images in This Article

Copyright and Terms & Conditions
© 2021. The American Astronomical Society. All rights reserved.
Copyright ©
2025 Astronomy Image Explorer. All Rights Reserved.