Image Details
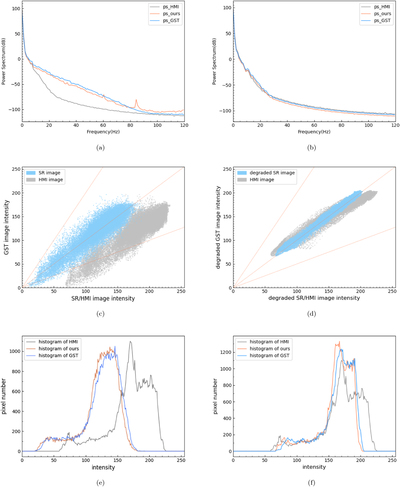
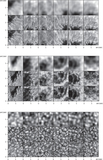
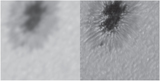
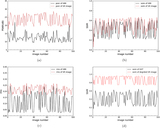
Caption: Figure 7.
The three rows are a comparison of the power spectrum, scatter plot, and gray histogram between an SR image and GST image on 2020 June 20 at 17:29:57 UT, respectively. The dotted lines in the scatter plot represent the auxiliary lines with slopes of 0.5, 1, and 2. The left column compares the HMI image, reconstructed image, and GST image. The right column compares the HMI image, blurred reconstructed image, and blurred GST image.
Other Images in This Article

Copyright and Terms & Conditions
© 2021. The American Astronomical Society. All rights reserved.
Copyright ©
2025 Astronomy Image Explorer. All Rights Reserved.