Image Details
Caption: Figure 5.
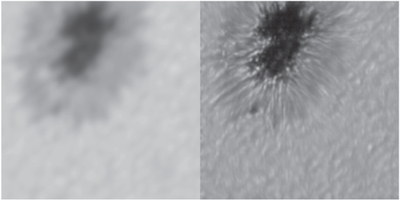
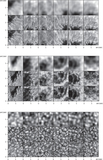
An animation of the super-resolution reconstructed results from 2017 September 1–9, comparing the input HMI images (left) to the SR images (right). The animation runs for 56 s, showing the much better typical dynamics of a sunspot from the reconstructed images. These improved dynamics include materials moving away from sunspots in the outer part of the penumbra and inward in the inner part.
(An animation of this figure is available.)
The video/animation of this figure is available in the online journal.
Other Images in This Article

Copyright and Terms & Conditions
© 2021. The American Astronomical Society. All rights reserved.
Copyright ©
2025 Astronomy Image Explorer. All Rights Reserved.