Image Details
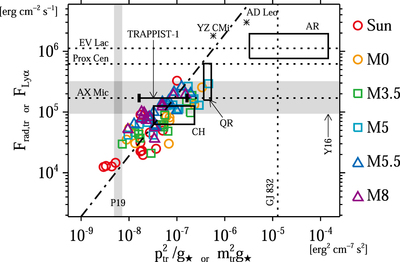
Caption: Figure 22.
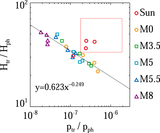
Properties of the M dwarf transition region in our simulation. The vertical axis shows the radiative losses from the transition region in our simulation and the observed stellar Lyα fluxes. The horizontal axis shows the quantity of ﹩{p}_{\mathrm{tr}}^{2}/{g}_{\star }﹩, where ﹩{p}_{\mathrm{tr}}﹩ is the plasma pressure at the transition region from our simulation or other literatures. The FLyα of the M dwarfs is reported by Byrne & Doyle (1989; for YZ CMi and AX Mic), Wood et al. (2005b; for AD Leo, EV Lac, and Proxima Centauri), Youngblood et al. (2016; for GJ 176, GJ 436, GJ 581, GJ 667C, GJ 832, GJ 876, and GJ 1214; they are indicated together by “Y16”) and Bourrier et al. (2017; for TRAPPIST-1). The FLyα from the solar AR, QR, and CH is estimated based on Fontenla et al. (1988, 1999), Curdt et al. (2008), and Tian et al. (2009). The ﹩{p}_{\mathrm{tr}}﹩ of the M dwarfs is reported by Giampapa et al. (1982; for YZ CMi), Mauas & Falchi (1994; for AD Leo), Fontenla et al. (2016; for GJ 832), Peacock et al. (2019a; for TRAPPIST-1), and Peacock et al. (2019b; for GJ 176, GJ 436, and GJ 832, indicated by “P19”). The ﹩{p}_{\mathrm{tr}}﹩ in the solar CH and QR is cited from Maxson & Vaiana (1977), while the ﹩{p}_{\mathrm{tr}}﹩ in the solar AR is cited from Yashiro & Shibata (2001). The dashed–dotted line represents a fitted line obtained by assuming the proportional relation between ﹩{p}_{\mathrm{tr}}^{2}/{g}_{\star }﹩ and ﹩{F}_{\mathrm{rad},\mathrm{tr}}﹩ (y = 1.90 × 10¹²x).
Other Images in This Article

Show More
Copyright and Terms & Conditions
© 2021. The American Astronomical Society. All rights reserved.