Image Details
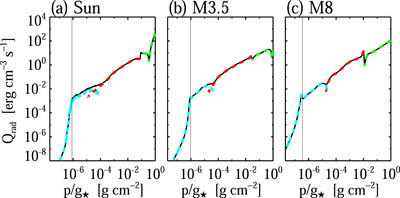
Caption: Figure 21.
Temporally averaged radiative cooling of stellar atmospheres as a function of p/g⋆, representing the column mass density (black lines). The green, red, and blue lines correspond to the cooling rates due to the photospheric, chromospheric, and coronal radiation, respectively (Qph, Qch, and Qco in Section 2.3). The thin vertical line shows the position of the transition region (i.e., ﹩{p}_{\mathrm{tr}}/{g}_{\star }﹩).
Other Images in This Article

Show More
Copyright and Terms & Conditions
© 2021. The American Astronomical Society. All rights reserved.
Copyright ©
2025 Astronomy Image Explorer. All Rights Reserved.