Image Details
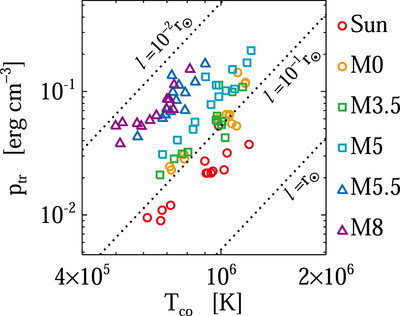
Caption: Figure 12.
Plasma pressure at the transition region (﹩{p}_{\mathrm{tr}}﹩) as a function of coronal temperature (Tco). The dotted lines represent ﹩y={\left(x/1.4\times {10}^{3}\right)}^{3}/l﹩, with l = (1, 10−1, 10−2)r⊙.
Other Images in This Article

Show More
Copyright and Terms & Conditions
© 2021. The American Astronomical Society. All rights reserved.
Copyright ©
2025 Astronomy Image Explorer. All Rights Reserved.