Image Details
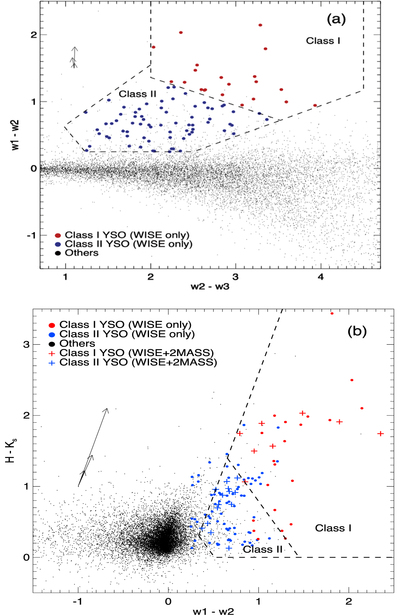
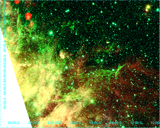
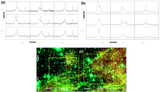
Caption: Figure 14.
(a) The mid-IR color–color diagram of HB 3 region determining Class I and Class II YSOs based on the criteria (marked in dotted boxes) of Koenig & Leisawitz (2014) using the WISE photometry only. The red, blue, and black dots show Class I YSO, Class II YSO, and other sources, respectively. The black data points within the defined boxes are background SFGs or Galactic AGB stars (Jarrett et al. 2019). (b) YSOs in the region viewed in a color–color diagram of 2MASS-WISE photometry data. The red and blue crosses indicate the Class I and Class II YSOs defined from the 2MASS-WISE color–color diagram, while the colored dots are from WISE color–color diagram. The dashed polygons of both plots are the color–color diagram criteria for Class I and Class II YSOs. Arrows in both plots are extinction vectors of AKs = 0.4, 0.8, and 2. The photometry of the Class I and II sources is available as the data behind the Figure.
(The data used to create this figure are available.)
Other Images in This Article

Show More
Copyright and Terms & Conditions
© 2021. The American Astronomical Society. All rights reserved.