Image Details
Caption: Figure 13.
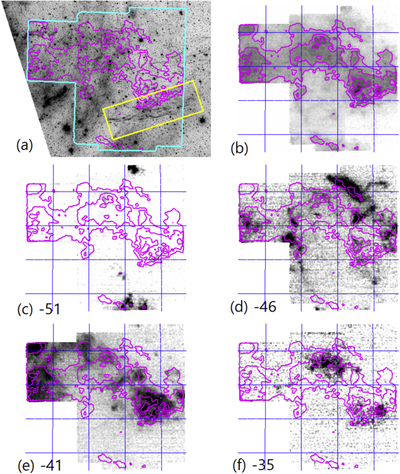
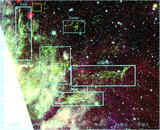
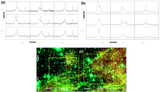
Kitt Peak 12 m CO(2-1) channel maps together with the Spitzer 4.5 μm mosaic toward the south and southeastern regions of HB 3; (a) Spitzer 4.5 μm superposed on molecular CO integrated intensity contours over VLST = −53 to −35 km s−1. (b) CO integrated map (from −53 to −35 km s−1), (c)–(f) = channel maps (Δ v = 0.65 km s−1) centered at −51, −46, −41, and −35 km s−1, respectively. The contours are those of integrated intensities at 20, 30, 40, 50 K km s−1. The yellow box in (a) is mentioned in the text. The −35 km s−1 CO clouds coincide with the observed H2 emission at the southern (outer) shell. In frames (b)–(f), coordinate grids are shown at every 1m 30s in R.A. from 2h 18m to 2h 22m 30s and at every ﹩10^{\prime} ﹩ in decl. from + 61° ﹩40^{\prime} ﹩ to + 62° ﹩10^{\prime} ﹩. The CO image is centered on R.A. 2h20m17s and decl. +61°55′37.5″ (J2000) with an FOV of 46.8′ × 42.8′.
Other Images in This Article

Show More
Copyright and Terms & Conditions
© 2021. The American Astronomical Society. All rights reserved.