Image Details

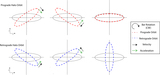
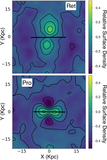
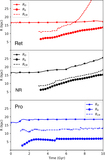
Caption: Figure 15.
Surface density contour plot of an edge-on slice (∣y∣ < 2 kpc) of the dark matter halo in the prograde model at t = 7.0 Gyr. The dark matter particle values are marked by rainbow contours. Stellar particles are indicated by the black dashed contours. The increasing contours of the stellar bar match the levels on the first four dark matter halo contours but are larger by an order of magnitude.
Other Images in This Article
Show More
Copyright and Terms & Conditions
© 2021. The American Astronomical Society. All rights reserved.
Copyright ©
2025 Astronomy Image Explorer. All Rights Reserved.