Image Details
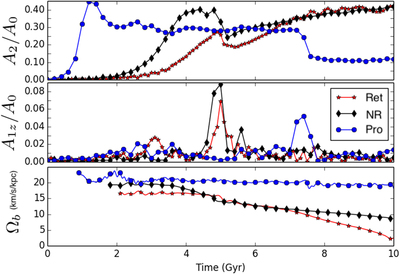
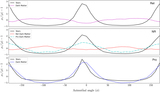
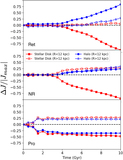
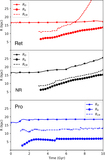
Caption: Figure 3.
Time evolution of stellar bar parameters for the three galaxy models. Top: evolution of the bar strength parameter (A2/A0) in the x/y-plane. Middle: evolution of the ratio of the Fourier m = 1 mode to the m = 0 mode (A1z/A0) in the x/z-plane. This quantity represents the growth in asymmetry normal to the midplane. Bottom: evolution of bar pattern speed (Ωb). Models are shown as (blue) circles for the prograde model, (black) diamonds for the nonrotating model, and (red) stars for the retrograde model.
Other Images in This Article
Show More
Copyright and Terms & Conditions
© 2021. The American Astronomical Society. All rights reserved.
Copyright ©
2025 Astronomy Image Explorer. All Rights Reserved.