Image Details
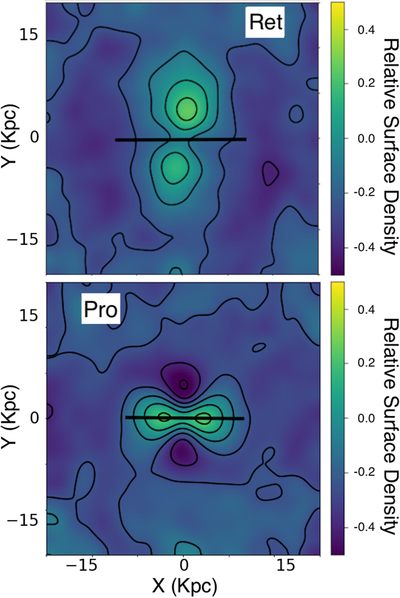
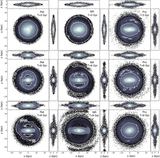
Caption: Figure 7.
Projected surface density response of dark matter halos in retrograde (top) vs. prograde (bottom) dark matter halos. We show the ratio of the projected dark matter density when the bar is strong compared to the initial density distribution at t = 0. The contour levels are given in the color palette. Positions of stellar bars are delineated by the straight horizontal line and they rotate clockwise in this frame. Note the dark matter bar in the retrograde model is almost perpendicular to the stellar bar.
Other Images in This Article
Show More
Copyright and Terms & Conditions
© 2021. The American Astronomical Society. All rights reserved.
Copyright ©
2025 Astronomy Image Explorer. All Rights Reserved.