Image Details
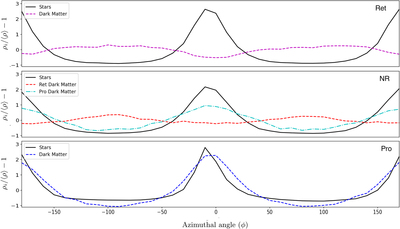
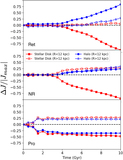
Caption: Figure 5.
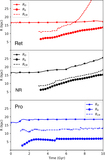
Stellar and dark matter density in each 10° sector (i) of an annulus (4 < R < 6 kpc and ∣z∣ < 3 kpc) compared to the average density in that annulus for each particle species. The stellar disk is shown by the solid black line, and the dark matter is shown with dashed lines. Dark matter density fluctuations are lower than stellar densities; each dark matter line is multiplied by 3 for ease of comparison. These measurements are taken at late times when stellar bars are strong. For the nonrotating and retrograde models, this is at t = 10 Gyr and for the prograde model at t = 7.8 Gyr. This plot shows that prograde dark matter orbits align with the stellar bar, while retrograde orbits align perpendicularly.
Other Images in This Article
Show More
Copyright and Terms & Conditions
© 2021. The American Astronomical Society. All rights reserved.