Image Details

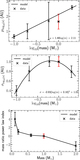
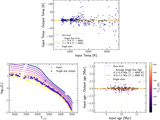
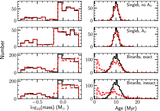
Caption: Figure 12.
Temperature vs. extinction for all 20 test systems for synchronous (black) and asynchronous (red) fits. The starting point of each arrow is the true value, and the end point is the fitted value. The asynchronous fits show systematic trends in extinction and temperature recovery, while the errors for the synchronous fits are typically smaller and more randomly oriented. In both cases the errors are small.
Other Images in This Article
Show More
Copyright and Terms & Conditions
© 2021. The American Astronomical Society. All rights reserved.
Copyright ©
2025 Astronomy Image Explorer. All Rights Reserved.