Image Details
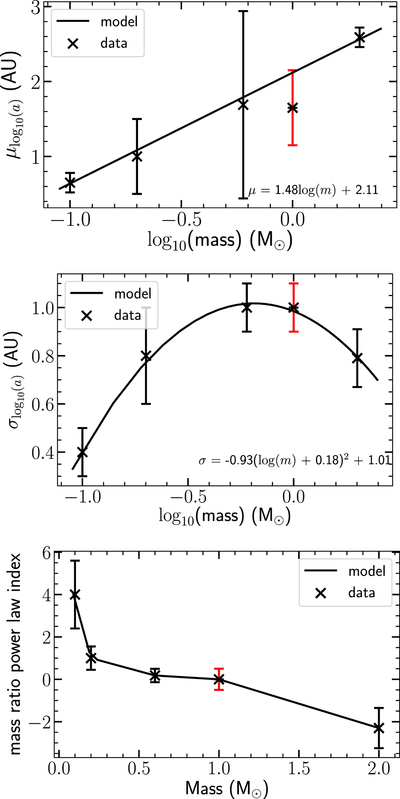
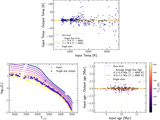
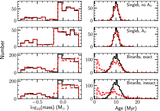
Caption: Figure 1.
Data from Table 1 plotted with models. The red error bars are values estimated from typical errors in the relevant measurements, because the literature did not list an error value. Top: The mean of the lognormal separation distribution is approximately linear in log(mass). Middle: The standard deviation of the lognormal separation distribution is approximately quadratic in log(mass). Bottom: The mass ratio power-law exponent was determined using a piecewise linear interpolation.
Other Images in This Article
Show More
Copyright and Terms & Conditions
© 2021. The American Astronomical Society. All rights reserved.
Copyright ©
2025 Astronomy Image Explorer. All Rights Reserved.