Image Details

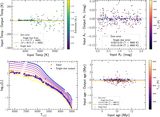
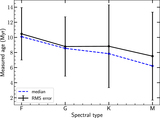
Caption: Figure 5.
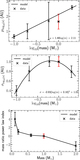
Fit summary plots for single stars without extinction. Top: Temperature residuals vs. input Teff for single stars. The average error is 1 K with an rms error of 10 K for Teff < 4800 K and −7 K with an rms error of 34 K for Teff ≥ 4800 K. Bottom left: An HR diagram with MIST isochrones underlaid, showing the input (orange) and output (purple) Teff vs. luminosity for single stars. The input and output match well. Bottom right: Age residuals (input–output age) vs. the input age for each single star. The average age error is −0.1 Myr with an rms of 0.4 Myr for Teff < 4800 K and 0.0 Myr with an rms of 1.5 Myr for Teff ≥ 4800 K.
Other Images in This Article
Show More
Copyright and Terms & Conditions
© 2021. The American Astronomical Society. All rights reserved.