Image Details

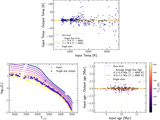
Caption: Figure 6.
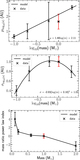
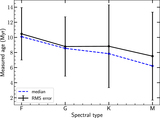
Fit summary plots for single stars with extinction. Top left: Input primary- or single-star temperature vs. Teff residuals between primary-star temperature and fitted-system temperature. The average temperature error is −1 K with an rms error of −5 K for Teff < 4800 K and −23 K with an rms error of 80 K for Teff ≥ 4800 K. The color bar shows the extinction value for each point. There is no observed correlation between extinction value and temperature residual, indicating that AV is determined well enough that it does not bias the Teff results. Top right: The extinction residual vs. the input extinction value. The residual has an average value of 0.00 mag with an rms of 0.02 mag for Teff < 4800 K and −0.01 mag with an rms of 0.04 mag for Teff ≥ 4800 K. The color bar shows the input primary-star temperature. Bottom left: HR diagram with MIST isochrones underlaid. The input stars are shown as orange points, while the output systems are shown as purple points. Extinction in the spectra does not significantly affect retrieval of parameters. Bottom right: Age residual vs. input age. The average age error is −0.2 Myr with an rms of 0.3 Myr for Teff < 4800 K and −0.3 Myr with an rms of 1.5 Myr for temperatures ≥ 4800 K. The presence of extinction does not change the observed spread in ages. Hotter stars show more scatter than cooler stars, due to the worse temperature recovery in hotter systems.
Other Images in This Article
Show More
Copyright and Terms & Conditions
© 2021. The American Astronomical Society. All rights reserved.