Image Details
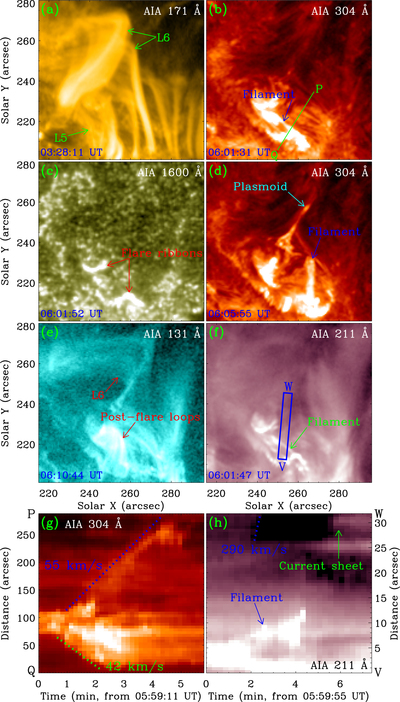
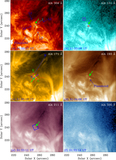
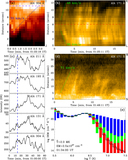
Caption: Figure 6.
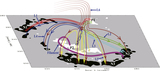
Filament eruption observed by AIA. (a) AIA 171 Å, (b) and (d) 304 Å, (c) 1600 Å, (e) 131 Å, and (f) 211 Å images. (g)–(h) Time slices of AIA 304 Å and 211 Å images along the green line PQ in (b) and along the VW direction in the blue rectangle in (f), respectively. The blue and green dotted lines in (g) separately outline the filament eruption and flare ribbon separation. The blue dotted line in (h) outlines the motion of loops. The moving speeds are denoted by the numbers in (g)–(h). The FOVs of (a)–(f) are denoted by the red rectangle in Figure 1(a). See Sections 3.1 and 3.2 for details.
Other Images in This Article
Copyright and Terms & Conditions
© 2021. The American Astronomical Society. All rights reserved.
Copyright ©
2025 Astronomy Image Explorer. All Rights Reserved.