Image Details
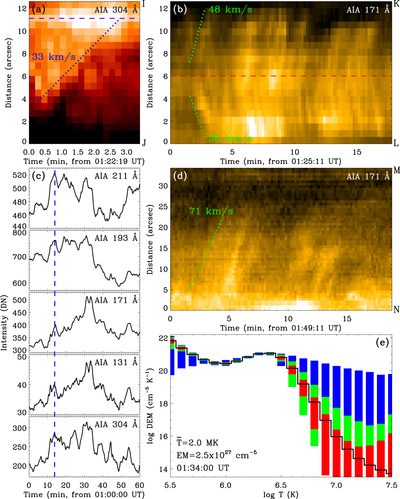
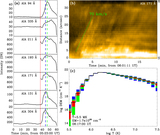
Caption: Figure 5.
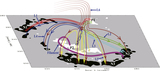
Temporal evolution of the magnetic reconnection between loops before the filament eruption observed by AIA. Time slices of (a) AIA 304 Å, and (b) and (d) 171 Å images along the cyan, green, and blue lines IJ, KL, and MN in Figures 4(a) and (c), respectively. (c) Light curves of the AIA EUV channels in the blue rectangle in Figure 4(e). (e) DEM curve for a current sheet region enclosed by the red rectangle in Figure 4(b). The blue and green dotted lines in (a), (b), and (d) separately outline the motions of loops and plasmoids, with moving speeds denoted by the numbers. The purple dashed line in (a) denotes the reconnection region. The red dashed line in (b) marks the middle of the current sheet. The blue vertical dashed line in (c) marks a peak of the EUV light curves. In (e), the black curve is the best-fit DEM distribution, and the red, green, and blue rectangles separately represent the regions containing 50%, 51%–80%, and 81%–95% of the Monte Carlo solutions. See Section 3.1 for details.
Other Images in This Article
Copyright and Terms & Conditions
© 2021. The American Astronomical Society. All rights reserved.